Blog

us.jpg   fr.jpg

Asset class volatility/return trade-off in June 2007

Picture7.png

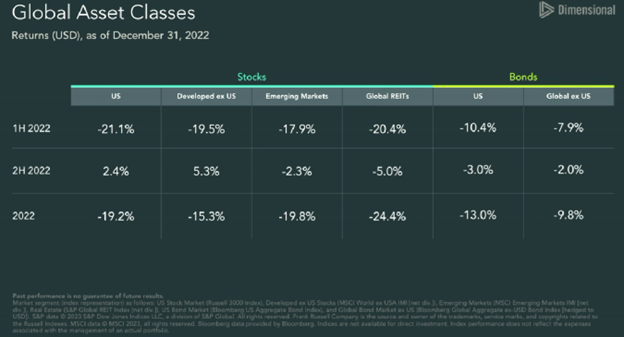
2022 asset class returns

Picture6.png

Inflation/deflation cycles historically average 18 years since 1870

Picture5.png

S&P 500 annual returns by decade since 1930

Picture4.png

Value of hypothetical $1,000 investment in the MSCI ACWI from 1/1/12-12/31/21

Picture3.png

10-year return projections for the liquid asset classes

Picture2.png

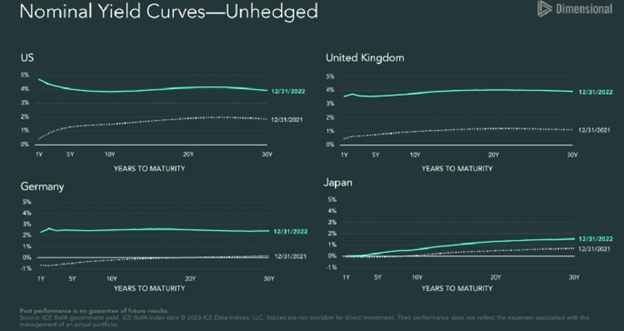
US treasury yields since 1990

Picture1.png

2020 Election: Agenda (Amundi Pioneer 2020)

Picture15.png

Government Debt as % of GDP (IMF 1990-2020)

Picture89.png

Coups and Coup Attempts Globally Since 1946

11.19.21.png

Syndicate content